Exploratory Data Analysis with K-Means Clustering Algorithm – The Best Place for the GymData Science is rightly regarded as the “Sexiest Job of the 21st century” by Harvard.
Hello, and welcome back to Gossipfunda. I’m sure that you are overwhelmed with the topic of today, and so am I. We have heard about Data Science and Machine Learning and how they are bringing out revolutions in technology. The decision-making process of all giant companies is successfully running because of the extraction of useful insights from the data. This is Data Science. Today, we won’t just be talking about “what”, we will be completing a Data Science project. First, I will introduce you to the project and the technique to complete it. You are the data scientist here, working to determine the best place for a Gym in North York, Ontario, Canada.
You will also see the use of the Exploratory Data Analysis with K-Means Clustering Algorithm, which is a popular Machine Learning algorithm for clustering. We won’t be going into much detail about the theory of K-Means clustering here because it’s out of the scope of the article.
If you know a bit of the Python Programming Language, reading this blog would be fun for you. Never mind if you don’t, it’s still enjoyable to understand the things that are happening behind the code. So remember, our main objective is to find out the best neighborhood for a Gym startup.
Don’t Miss: How to become a Full Stack Developer?
About the Data
The Data that we will be using is a list of boroughs and neighborhoods in Canada along with their postal codes. To get this data, we will scrape the Wikipedia page and load the tables into a Pandas Dataframe. Well, you can do this with BeautifulSoup as well, but we will keep things simple here.

Exploratory Data Analysis: Project Overview
In this Project, we are to find the best neighborhoods for a Gym startup, in North York, Canada. We will also find out the top neighborhoods in North York that has Gym. This will help fitness freak and body builders choose their right neighborhood in North York, if they’re planning to shift there.
FourSquare API
The FourSquare API is what we shall use to fetch the details of venues in the neighborhoods of North York. FourSquare is a very popular location data provider, that powers some giant companies, like Uber.
Machine Learning Algorithm used
In this project, we will be using the K-Means Clustering algorithm to cluster the neighborhoods. As you will see, we shall cluster the neighborhoods into 4 groups. The K-Means Clustering is one of the most popular Clustering algorithms that is efficient as it runs fast. There remains a problem of finding the right value of k, that is the optimum number of clusters. However, the algorithm is pretty fast, running the clustering multiple times with different values of k, and then plotting a graph to note down the k for which the error is minimum (best k) is not an ordeal.
In this project exploratory data analysis, we are using the Canadian postal code data from Wikipedia. We will gather the data by parsing the web page using Pandas’ read_html method. We shall perform exploratory data analysis on the data to determine the ideal neighborhood for a Gym startup in North York, Canada. We will use the FourSquare API to fetch the location data and data about the venues in North York’s neighborhoods.
Let’s get straight away to the project, and let’s see how an Exploratory Data Analysis project looks like.
First, we import the required libraries
import numpy as np
import pandas as pd
import json # library to handle JSON files
from geopy.geocoders import Nominatim

import requests # library to handle requests
from pandas.io.json import json_normalize # tranform JSON file into a pandas dataframe

# Matplotlib and associated plotting modules
import matplotlib.cm as cm
import matplotlib.colors as colors

# import k-means from clustering stage
from sklearn.cluster import KMeans

import folium # map rendering library
Define the data source url and read the data into a Pandas dataframe
url = "https://en.wikipedia.org/wiki/List_of_postal_codes_of_Canada:_M"
df1, df2, df3 = pd.read_html(url)
print("Data successfully read into Pandas dataframe. Here's the first five rows:")
df1.head()
Data successfully read into Pandas dataframe. Here's the first five rows:
| Postal Code | Borough | Neighbourhood | |
|---|---|---|---|
| 0 | M1A | Not assigned | Not assigned |
| 1 | M2A | Not assigned | Not assigned |
| 2 | M3A | North York | Parkwoods |
| 3 | M4A | North York | Victoria Village |
| 4 | M5A | Downtown Toronto | Regent Park, Harbourfront |
However, there are some rows we need to get rid of. The Boroughs that are not assigned are not required, so let’s drop them and clean the dataset.
Cleaning the dataset
for row, item in enumerate(df1.Borough.tolist()):
    if item == "Not assigned":
        df1.drop(row, axis=0, inplace=True)

df1.set_index("Postal Code", inplace=True)
df1.reset_index(inplace=True)
df1.head()     # To view the first five rows of the cleaned dataset
| Postal Code | Borough | Neighbourhood | |
|---|---|---|---|
| 0 | M3A | North York | Parkwoods |
| 1 | M4A | North York | Victoria Village |
| 2 | M5A | Downtown Toronto | Regent Park, Harbourfront |
| 3 | M6A | North York | Lawrence Manor, Lawrence Heights |
| 4 | M7A | Downtown Toronto | Queen’s Park, Ontario Provincial Government |
Reading the Latitude and Longitude data from the CSV file
Now that we have the required dataset containing Postal code, Borough name and neighborhood name, we have to read the latitude and longitude data from the CSV file and add it to the dataset.
latlon_df = pd.read_csv("https://cocl.us/Geospatial_data")
latlon_df.set_index("Postal Code", inplace=True)
latlon_df.head()
| Latitude | Longitude | |
|---|---|---|
| Postal Code | ||
| M1B | 43.806686 | -79.194353 |
| M1C | 43.784535 | -79.160497 |
| M1E | 43.763573 | -79.188711 |
| M1G | 43.770992 | -79.216917 |
| M1H | 43.773136 | -79.239476 |
new_df = pd.merge(df1, latlon_df, how='inner', on="Postal Code")
new_df.head()
| Postal Code | Borough | Neighbourhood | Latitude | Longitude | |
|---|---|---|---|---|---|
| 0 | M3A | North York | Parkwoods | 43.753259 | -79.329656 |
| 1 | M4A | North York | Victoria Village | 43.725882 | -79.315572 |
| 2 | M5A | Downtown Toronto | Regent Park, Harbourfront | 43.654260 | -79.360636 |
| 3 | M6A | North York | Lawrence Manor, Lawrence Heights | 43.718518 | -79.464763 |
| 4 | M7A | Downtown Toronto | Queen’s Park, Ontario Provincial Government | 43.662301 | -79.389494 |
new_df.rename(columns={'Neighbourhood':'Neighborhood'}, inplace=True)
new_df.head()
| Postal Code | Borough | Neighborhood | Latitude | Longitude | |
|---|---|---|---|---|---|
| 0 | M3A | North York | Parkwoods | 43.753259 | -79.329656 |
| 1 | M4A | North York | Victoria Village | 43.725882 | -79.315572 |
| 2 | M5A | Downtown Toronto | Regent Park, Harbourfront | 43.654260 | -79.360636 |
| 3 | M6A | North York | Lawrence Manor, Lawrence Heights | 43.718518 | -79.464763 |
| 4 | M7A | Downtown Toronto | Queen’s Park, Ontario Provincial Government | 43.662301 | -79.389494 |
Now we have come a long way through gathering and cleaning the data. Now that we have a good looking dataset of Canadian neighborhoods, lets cluster the neighborhoods in North York.
Clustering Neighborhoods in North York
ny_df = new_df[new_df["Borough"]=="North York"].reset_index(drop=True)
ny_df.head()
| Postal Code | Borough | Neighborhood | Latitude | Longitude | |
|---|---|---|---|---|---|
| 0 | M3A | North York | Parkwoods | 43.753259 | -79.329656 |
| 1 | M4A | North York | Victoria Village | 43.725882 | -79.315572 |
| 2 | M6A | North York | Lawrence Manor, Lawrence Heights | 43.718518 | -79.464763 |
| 3 | M3B | North York | Don Mills | 43.745906 | -79.352188 |
| 4 | M6B | North York | Glencairn | 43.709577 | -79.445073 |
print("There are {} neighborhoods in North York, Canada".format(ny_df.shape[0]))
There are 24 neighborhoods in North York, Canada
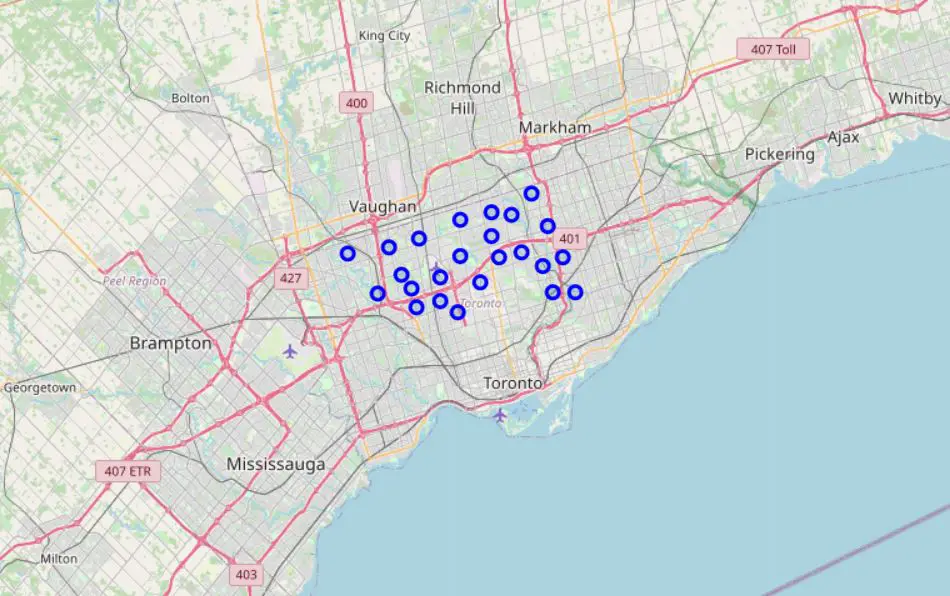
Let’s get the latitude and longitude values of North York and visualize it on a map.
address = 'North York, Ontario'
geolocator = Nominatim(user_agent="ny_explorer")
location = geolocator.geocode(address)
latitude = location.latitude
longitude = location.longitude
print("Geographical coordinates of North York are {}, {}".format(latitude, longitude))
Geographical coordinates of North York are 43.7543263, -79.44911696639593
map_ny = folium.Map(location=[latitude, longitude], zoom_start=10)
for lat, lng, borough, neighborhood in zip(ny_df['Latitude'], ny_df['Longitude'], ny_df['Borough'], ny_df['Neighborhood']):
    label = '{}, {}'.format(neighborhood, borough)
    label = folium.Popup(label, parse_html=True)
    folium.CircleMarker([lat, lng], radius=5, popup=label, color='blue', fill=True, fill_color="#3186cc", parse_html=False).add_to(map_ny)
map_ny
Start utilizing the FourSquare API to fetch venue details
Define the FourSquare credentials
CLIENT_ID = 'xxxx' # your Foursquare ID
CLIENT_SECRET = 'xxxx' # your Foursquare Secret
VERSION = '20180605' # Foursquare API version
LIMIT = 100 # A default Foursquare API limit value
Now that we have our FourSquare credentials defined, let’s create two methods. The first method extracts the category of each venue. The second method gives us venues of all neighborhoods in North York:
def get_category_type(row):
    try:
        categories_list = row['categories']
    except:
        categories_list = row['venue.categories']

    return categories_list[0]['name']
def getNearbyVenues(names, latitudes, longitudes, radius=500):

    venues_list=[]
    for name, lat, lng in zip(names, latitudes, longitudes):
        # create the API request URL
        url = 'https://api.foursquare.com/v2/venues/explore?&client_id={}&client_secret={}&v={}&ll={},{}&radius={}&limit={}'\
        .format(CLIENT_ID, CLIENT_SECRET, VERSION, lat, lng, radius, LIMIT)

        # make the GET request
        results = requests.get(url).json()["response"]['groups'][0]['items']

        venues_list.append([(name, lat, lng,
                             v['venue']['name'], v['venue']['location']['lat'], v['venue']['location']['lng'],
                             v['venue']['categories'][0]['name']) for v in results])

    nearby_venues = pd.DataFrame([item for venue in venues_list for item in venue])
    nearby_venues.columns = ['Neighborhood','Neighborhood Latitude', 'Neighborhood Longitude',
                             'Venue', 'Venue Latitude', 'Venue Longitude', 'Venue Category']

    return nearby_venues
ny_venues=getNearbyVenues(ny_df['Neighborhood'], ny_df['Latitude'], ny_df['Longitude'])
ny_venues.head()
| Neighborhood | Neighborhood Latitude | Neighborhood Longitude | Venue | Venue Latitude | Venue Longitude | Venue Category | |
|---|---|---|---|---|---|---|---|
| 0 | Parkwoods | 43.753259 | -79.329656 | Brookbanks Park | 43.751976 | -79.332140 | Park |
| 1 | Parkwoods | 43.753259 | -79.329656 | Variety Store | 43.751974 | -79.333114 | Food & Drink Shop |
| 2 | Victoria Village | 43.725882 | -79.315572 | Victoria Village Arena | 43.723481 | -79.315635 | Hockey Arena |
| 3 | Victoria Village | 43.725882 | -79.315572 | Tim Hortons | 43.725517 | -79.313103 | Coffee Shop |
| 4 | Victoria Village | 43.725882 | -79.315572 | Portugril | 43.725819 | -79.312785 | Portuguese Restaurant |
num_unique_cat = len(ny_venues['Venue Category'].unique())
print('There are {} unique categories!'.format(num_unique_cat))
There are 102 unique categories!
Let’s take a look at the unique categories.
print(ny_venues["Venue Category"].unique())
['Park' 'Food & Drink Shop' 'Hockey Arena' 'Coffee Shop'
 'Portuguese Restaurant' 'French Restaurant' 'Boutique'
 'Furniture / Home Store' 'Vietnamese Restaurant' 'Clothing Store'
 'Accessories Store' 'Event Space' "Women's Store" 'Miscellaneous Shop'
 'Sporting Goods Shop' 'Caribbean Restaurant' 'Café' 'Gym'
 'Japanese Restaurant' 'Bakery' 'Sushi Restaurant' 'Pub' 'Pizza Place'
 'Italian Restaurant' 'Discount Store' 'Restaurant' 'Bike Shop'
 'Beer Store' 'Art Gallery' 'Dim Sum Restaurant' 'Supermarket'
 'Sandwich Place' 'Chinese Restaurant' 'Golf Course' 'Pool'
 'Mediterranean Restaurant' 'Dog Run' 'Deli / Bodega' 'Bridal Shop'
 'Middle Eastern Restaurant' 'Ice Cream Shop' 'Bank' 'Diner'
 'Fried Chicken Joint' 'Shopping Mall' 'Gas Station' 'Pharmacy'
 'Mobile Phone Shop' 'Toy / Game Store' 'American Restaurant'
 'Electronics Store' 'Movie Theater' 'Chocolate Shop' 'Salon / Barbershop'
 'Juice Bar' 'Burger Joint' 'Theater' 'Department Store' 'Liquor Store'
 'Video Game Store' 'Food Court' 'Fast Food Restaurant' 'Asian Restaurant'
 'Cosmetics Shop' 'Burrito Place' 'Bar' "Men's Store" 'Supplement Shop'
 'Snack Place' 'Distribution Center' 'Luggage Store' 'Jewelry Store'
 'Dessert Shop' 'Spa' 'Convenience Store' 'Intersection' 'Baseball Field'
 'Massage Studio' 'Falafel Restaurant' 'Airport' 'Cafeteria'
 'Grocery Store' 'Construction & Landscaping' 'Business Service'
 'Korean Restaurant' 'Food Truck' 'Indian Restaurant' 'Thai Restaurant'
 'Comfort Food Restaurant' 'Greek Restaurant' 'Butcher' 'Hobby Shop'
 'Ramen Restaurant' 'Steakhouse' 'Arts & Crafts Store' 'Plaza' 'Lounge'
 'Pet Store' 'Bubble Tea Shop' 'Hotel' 'Athletics & Sports'
 'Gym / Fitness Center']
Analyze each Neighborhood
Now it’s time to one-hot encode the new dataframe and explore each neighborhood.
# one hot encoding
ny_onehot = pd.get_dummies(ny_venues[['Venue Category']], prefix="", prefix_sep="")

# add neighborhood column back into the dataframe
ny_onehot['Neighborhood'] = ny_venues['Neighborhood']

# move the neighborhood column to the first column
fixed_columns = [ny_onehot.columns[-1]] + list(ny_onehot.columns[:-1])
ny_onehot = ny_onehot[fixed_columns]
ny_onehot.head()
| Neighborhood | Accessories Store | Airport | American Restaurant | Art Gallery | Arts & Crafts Store | Asian Restaurant | Athletics & Sports | Bakery | Bank | … | Steakhouse | Supermarket | Supplement Shop | Sushi Restaurant | Thai Restaurant | Theater | Toy / Game Store | Video Game Store | Vietnamese Restaurant | Women’s Store | |
|---|---|---|---|---|---|---|---|---|---|---|---|---|---|---|---|---|---|---|---|---|---|
| 0 | Parkwoods | 0 | 0 | 0 | 0 | 0 | 0 | 0 | 0 | 0 | … | 0 | 0 | 0 | 0 | 0 | 0 | 0 | 0 | 0 | 0 |
| 1 | Parkwoods | 0 | 0 | 0 | 0 | 0 | 0 | 0 | 0 | 0 | … | 0 | 0 | 0 | 0 | 0 | 0 | 0 | 0 | 0 | 0 |
| 2 | Victoria Village | 0 | 0 | 0 | 0 | 0 | 0 | 0 | 0 | 0 | … | 0 | 0 | 0 | 0 | 0 | 0 | 0 | 0 | 0 | 0 |
| 3 | Victoria Village | 0 | 0 | 0 | 0 | 0 | 0 | 0 | 0 | 0 | … | 0 | 0 | 0 | 0 | 0 | 0 | 0 | 0 | 0 | 0 |
| 4 | Victoria Village | 0 | 0 | 0 | 0 | 0 | 0 | 0 | 0 | 0 | … | 0 | 0 | 0 | 0 | 0 | 0 | 0 | 0 | 0 | 0 |
5 rows × 103 columns
Group rows by neighborhood and by taking the mean of the frequency of occurence of each category.
ny_grouped = ny_onehot.groupby('Neighborhood').mean().reset_index()
ny_grouped.head()
| Neighborhood | Accessories Store | Airport | American Restaurant | Art Gallery | Arts & Crafts Store | Asian Restaurant | Athletics & Sports | Bakery | Bank | … | Steakhouse | Supermarket | Supplement Shop | Sushi Restaurant | Thai Restaurant | Theater | Toy / Game Store | Video Game Store | Vietnamese Restaurant | Women’s Store | |
|---|---|---|---|---|---|---|---|---|---|---|---|---|---|---|---|---|---|---|---|---|---|
| 0 | Bathurst Manor, Wilson Heights, Downsview North | 0.0 | 0.000000 | 0.000000 | 0.000000 | 0.0 | 0.0 | 0.000000 | 0.0 | 0.105263 | … | 0.0 | 0.052632 | 0.0 | 0.052632 | 0.000000 | 0.0 | 0.000000 | 0.0 | 0.0 | 0.0 |
| 1 | Bayview Village | 0.0 | 0.000000 | 0.000000 | 0.000000 | 0.0 | 0.0 | 0.000000 | 0.0 | 0.250000 | … | 0.0 | 0.000000 | 0.0 | 0.000000 | 0.000000 | 0.0 | 0.000000 | 0.0 | 0.0 | 0.0 |
| 2 | Bedford Park, Lawrence Manor East | 0.0 | 0.000000 | 0.041667 | 0.000000 | 0.0 | 0.0 | 0.000000 | 0.0 | 0.000000 | … | 0.0 | 0.000000 | 0.0 | 0.041667 | 0.083333 | 0.0 | 0.041667 | 0.0 | 0.0 | 0.0 |
| 3 | Don Mills | 0.0 | 0.000000 | 0.000000 | 0.041667 | 0.0 | 0.0 | 0.000000 | 0.0 | 0.000000 | … | 0.0 | 0.041667 | 0.0 | 0.000000 | 0.000000 | 0.0 | 0.000000 | 0.0 | 0.0 | 0.0 |
| 4 | Downsview | 0.0 | 0.058824 | 0.000000 | 0.000000 | 0.0 | 0.0 | 0.058824 | 0.0 | 0.058824 | … | 0.0 | 0.000000 | 0.0 | 0.000000 | 0.000000 | 0.0 | 0.000000 | 0.0 | 0.0 | 0.0 |
5 rows × 103 columns
Let’s take a look at all the neighborhoods that lack Gym. We do this by extracting the neighborhoods for which the mean value of Gym = 0.
no_gym = ny_grouped[ny_grouped["Gym"]==0]
no_gym=no_gym[["Neighborhood"]]
no_gym.head()
| Neighborhood | |
|---|---|
| 0 | Bathurst Manor, Wilson Heights, Downsview North |
| 1 | Bayview Village |
| 2 | Bedford Park, Lawrence Manor East |
| 4 | Downsview |
| 5 | Fairview, Henry Farm, Oriole |
Hence, the above are the neighborhoods that have no Gym setup within it. Starting a gym in these neighborhoods are more likely to run smoothly due to the absence of previously built gym.
Now that we have come to know the neighborhoods that have no Gym, let’s also look at the neighborhoods that have Gym set up in them.
gym = ny_grouped[ny_grouped["Gym"]>=0.01]
gym[["Neighborhood", "Gym"]]
| Neighborhood | Gym | |
|---|---|---|
| 3 | Don Mills | 0.125 |
| 8 | Humber Summit | 0.500 |
import matplotlib.pyplot as plt
import seaborn as sns
sns.barplot(x="Neighborhood", y="Gym", data=gym)
plt.title("Distribution of Gyms in Don Mills and Humber Summit")
plt.show()
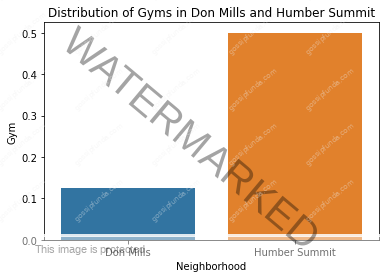
The above graph lets us visualize that Gyms are more common in Humber Summit than in Don Mills. Hence, if one has to choose from these two neighborhoods to stay in North York for better access to a Gym, Humber Summit is the best choice.
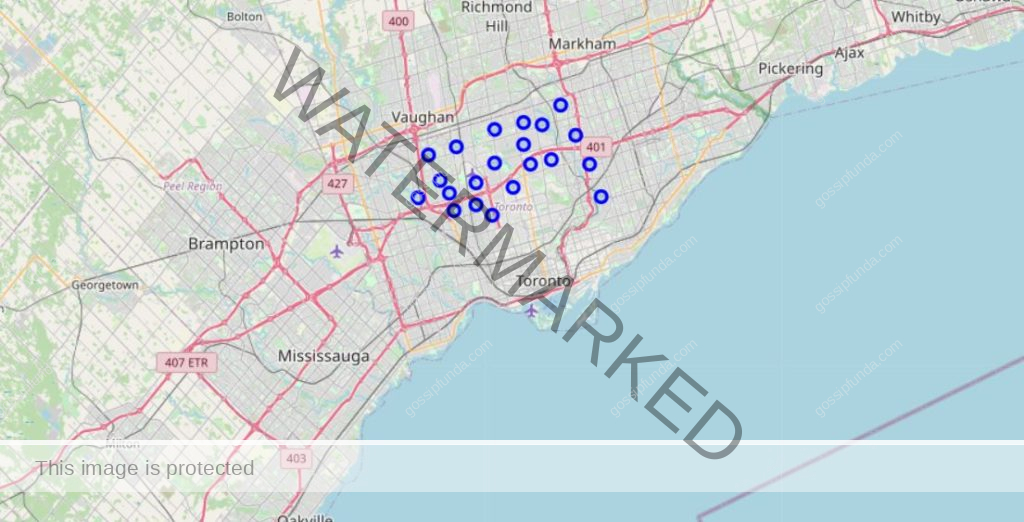
Plotting the Neighborhoods with no Gym
Let’s use the folium Library to plot the neighborhoods with no Gym. We need to work a bit on the no_gym dataframe for that by adding latitude and longitude values of the neighborhoods.
plot_df = pd.merge(no_gym, new_df, how='inner', on="Neighborhood")
plot_df = plot_df[["Neighborhood", "Latitude", "Longitude"]]
plot_df.head()
| Neighborhood | Latitude | Longitude | |
|---|---|---|---|
| 0 | Bathurst Manor, Wilson Heights, Downsview North | 43.754328 | -79.442259 |
| 1 | Bayview Village | 43.786947 | -79.385975 |
| 2 | Bedford Park, Lawrence Manor East | 43.733283 | -79.419750 |
| 3 | Downsview | 43.737473 | -79.464763 |
| 4 | Downsview | 43.739015 | -79.506944 |
map_nogym = folium.Map(location=[latitude, longitude], zoom_start=10)
for lat, lng, neighborhood in zip(plot_df['Latitude'], plot_df['Longitude'], plot_df['Neighborhood']):
    label = '{}'.format(neighborhood)
    label = folium.Popup(label, parse_html=True)
    folium.CircleMarker([lat, lng], radius=5, popup=label, color='blue', fill=True, fill_color="#3186cc", parse_html=False).add_to(map_nogym)
map_nogym
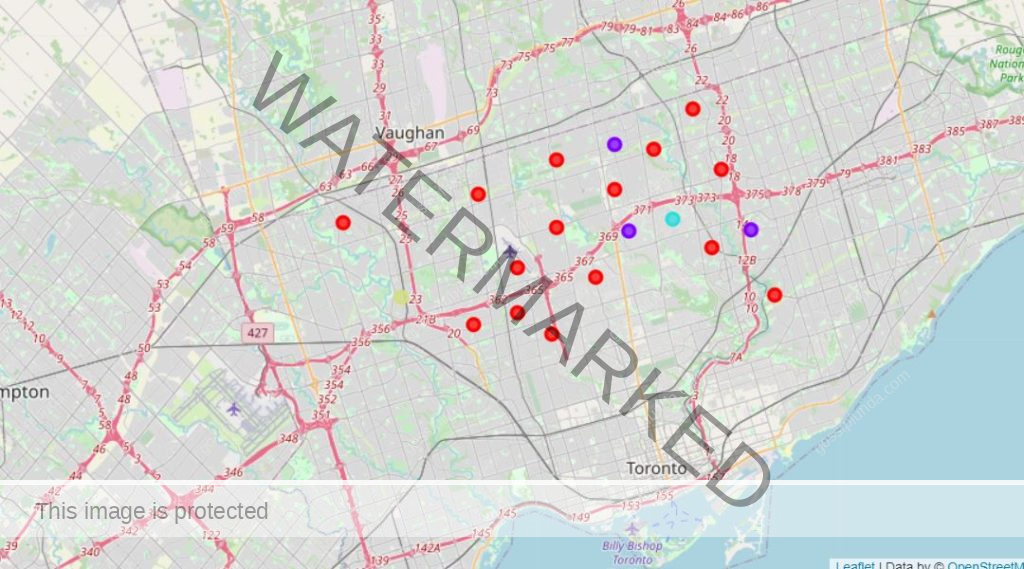
Clustering the Neighborhoods using K-Means Cluster
Let’s cluster the neighborhoods using the K-Means Clustering Algorithms, then we will visualize it on a map.
k = 4
X = ny_grouped.drop('Neighborhood', axis = 1)
# run k-means clustering
kmeans = KMeans(n_clusters = k, random_state=0, init="k-means++")
kmeans.fit(X)
KMeans(n_clusters=4, random_state=0)
new_cluster_df = pd.merge(ny_grouped, ny_df, how='inner', on='Neighborhood')
new_cluster_df=new_cluster_df[["Neighborhood", "Latitude", "Longitude"]]
new_cluster_df.drop_duplicates(subset=["Neighborhood"], inplace=True)
new_cluster_df.set_index("Neighborhood", inplace=True)
new_cluster_df.reset_index(inplace=True)
new_cluster_df.head()
| Neighborhood | Latitude | Longitude | |
|---|---|---|---|
| 0 | Bathurst Manor, Wilson Heights, Downsview North | 43.754328 | -79.442259 |
| 1 | Bayview Village | 43.786947 | -79.385975 |
| 2 | Bedford Park, Lawrence Manor East | 43.733283 | -79.419750 |
| 3 | Don Mills | 43.745906 | -79.352188 |
| 4 | Downsview | 43.737473 | -79.464763 |
new_cluster_df['Cluster_Labels'] = kmeans.labels_
new_cluster_df.head()
| Neighborhood | Latitude | Longitude | Cluster_Labels | |
|---|---|---|---|---|
| 0 | Bathurst Manor, Wilson Heights, Downsview North | 43.754328 | -79.442259 | 0 |
| 1 | Bayview Village | 43.786947 | -79.385975 | 0 |
| 2 | Bedford Park, Lawrence Manor East | 43.733283 | -79.419750 | 0 |
| 3 | Don Mills | 43.745906 | -79.352188 | 0 |
| 4 | Downsview | 43.737473 | -79.464763 | 0 |
map_clustered = folium.Map(location=[latitude, longitude], zoom_start=11)

# set color scheme for the clusters
x = np.arange(k)
ys = [i + x + (i*x)**2 for i in range(k)]
colors_array = cm.rainbow(np.linspace(0, 1, len(ys)))
rainbow = [colors.rgb2hex(i) for i in colors_array]

# add markers to the map
markers_colors = []
for lat, lon, poi, cluster in zip(new_cluster_df['Latitude'], new_cluster_df['Longitude'],
                                  new_cluster_df['Neighborhood'], new_cluster_df['Cluster_Labels']):
    label = folium.Popup(str(poi) + ' Cluster ' + str(cluster), parse_html=True)
    folium.CircleMarker(
        [lat, lon],
        radius=5,
        popup=label,
        color=rainbow[cluster-1],
        fill=True,
        fill_color=rainbow[cluster-1],
        fill_opacity=0.7).add_to(map_clustered)

map_clustered
Conclusion
In conclusion of exploratory data analysis with K-Means Clustering Algorithm, we see that we have only two neighborhoods that do not lack Gym. They are:
gym[["Neighborhood"]]
| Neighborhood | |
|---|---|
| 3 | Don Mills |
| 8 | Humber Summit |
The other neighborhoods that lack Gym, are:
no_gym[["Neighborhood"]]
| Neighborhood | |
|---|---|
| 0 | Bathurst Manor, Wilson Heights, Downsview North |
| 1 | Bayview Village |
| 2 | Bedford Park, Lawrence Manor East |
| 4 | Downsview |
| 5 | Fairview, Henry Farm, Oriole |
| 6 | Glencairn |
| 7 | Hillcrest Village |
| 9 | Humberlea, Emery |
| 10 | Lawrence Manor, Lawrence Heights |
| 11 | North Park, Maple Leaf Park, Upwood Park |
| 12 | Northwood Park, York University |
| 13 | Parkwoods |
| 14 | Victoria Village |
| 15 | Willowdale, Newtonbrook |
| 16 | Willowdale, Willowdale East |
| 17 | Willowdale, Willowdale West |
| 18 | York Mills West |
| 19 | York Mills, Silver Hills |
We have also clustered the neighborhood using the K-Means Clustering Algorithm. Also, our data analysis shows that if a fitness lover has to stay in North York, Don Mills and Humber Summit are the best choices. This is because they have Gyms as one of their most common venues. “Here’s a link to the code in Watson Studio, feel free to check it out”

I am a tech enthusiast. I have a keen curiosity in Data Science, Machine Learning, Deep Learning and Neural Networks. I have acquired knowledge in Python, SQL, Java, Amazon Web Services (AWS) and IoT (Internet of Things). I have built a couple of ML models and worked on datasets in IBM Watson Studio. Besides, I take great delight in content writing, which makes me come here, as I believe that this is one of the most reliable techniques for sharing one’s skill.